Quickstart#
This notebook serves as a short tutorial on how to use the clusterxplain package for calculating feature importance values. We will therefore use the iris dataset form scikit-learn.
Imports#
[2]:
from sklearn import datasets
from sklearn.cluster import KMeans
from cxplain.xkm import XkmExplainer
Fit a k-means clustering#
[4]:
# load iris data
iris = datasets.load_iris()

# set params
n_clusters = 3
X = iris.data
y = iris.target
n_obs = X.shape[0]
n_features = X.shape[1]
feature_names = iris.feature_names

# fit Kmeans
kmeans = KMeans(n_clusters=n_clusters, random_state=3, n_init=10).fit(X)
cluster_centers = kmeans.cluster_centers_
predictions = kmeans.predict(X)
predictions
[4]:
array([0, 0, 0, 0, 0, 0, 0, 0, 0, 0, 0, 0, 0, 0, 0, 0, 0, 0, 0, 0, 0, 0,
       0, 0, 0, 0, 0, 0, 0, 0, 0, 0, 0, 0, 0, 0, 0, 0, 0, 0, 0, 0, 0, 0,
       0, 0, 0, 0, 0, 0, 1, 1, 2, 1, 1, 1, 1, 1, 1, 1, 1, 1, 1, 1, 1, 1,
       1, 1, 1, 1, 1, 1, 1, 1, 1, 1, 1, 2, 1, 1, 1, 1, 1, 1, 1, 1, 1, 1,
       1, 1, 1, 1, 1, 1, 1, 1, 1, 1, 1, 1, 2, 1, 2, 2, 2, 2, 1, 2, 2, 2,
       2, 2, 2, 1, 1, 2, 2, 2, 2, 1, 2, 1, 2, 1, 2, 2, 1, 1, 2, 2, 2, 2,
       2, 1, 2, 2, 2, 2, 1, 2, 2, 2, 1, 2, 2, 2, 1, 2, 2, 1])
Explaining the Clustering#
In order to explain the clustering produced above clusterxplain offers various Explainers:
XkmExplainerDecisionTreeExplainerRandomForestExplainerExKMCExplainerShapExplainerNeonExplainerGradientExplainer
All explainers expose the same API by having a fit(), explain(), and fit_explain() method implemented. The explain() or fit_explain() return an instance of the ExplainedClustering class, which holds all calculated feature importance values and some convenience functions for plotting.
This tutorial will showcase the XKM method, but every other explainer works the same.
Note that not all explainers calculate point-wise and cluster-wise feature importances, only global ones. XkmExplainer, ShapExplainer, NeonExplainer and GradientExplainer calculate all three kinds of importance values.
Note that the XkmExplainer comes in two flavours, namely "next_best" or "all". Both flavours are described in (TBD). Basically "next_best" uses only the the distance to closest cluster on a feture dimension to calculate importance values. whereas "all" uses the distances to all clusters. Additionally you have to specify which metric you used for clustering, in our case of ordinary k-means this corresponds to "euclidean", but you could also choose "manhatten".
[7]:
# fit the explainer and calculate feature importances
explained_clustering = XkmExplainer(data=X, cluster_centers=cluster_centers, flavour="next_best", distance_metric="euclidean", cluster_predictions=predictions).fit_explain()
The resulting instance of the ExplainedClustering class can then be used to plot the calculated importance values. You can also retrieve the importance values as dataframe by the property explained_clustering.pointwise_relevance_df,explained_clustering.cluster_relevance_df, explained_clustering.global_relevance_df.
[8]:
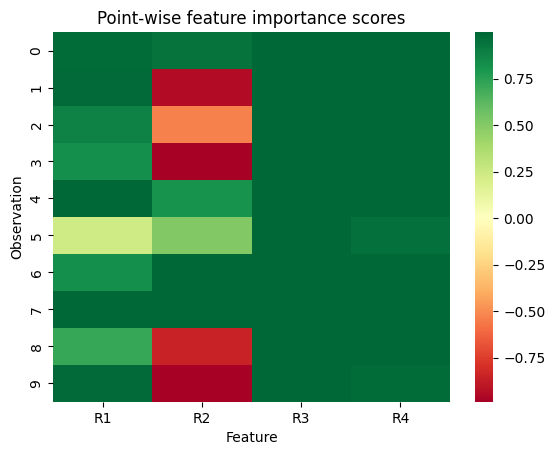
# plot pointwise relevances for observations 1-10
explained_clustering.show_pointwise_relevance(subset_index=list(range(10)))
[9]:
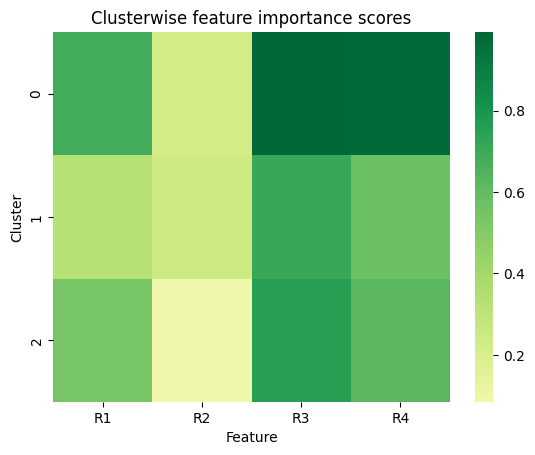
# plot cluster-wise feature importances
explained_clustering.show_cluster_relevance()
[10]:
# plot global feature importances
explained_clustering.show_global_relevance()

[11]:
# retrieve cluster-wise importance values as df
explained_clustering.cluster_relevance_df
[11]:
| R1 | R2 | R3 | R4 | |
|---|---|---|---|---|
| assigned_clusters | ||||
| 0 | 0.686290 | 0.221374 | 0.992866 | 0.980448 |
| 1 | 0.328449 | 0.246249 | 0.711564 | 0.578215 |
| 2 | 0.537812 | 0.084899 | 0.754957 | 0.621068 |